
|
|
|
|
|
|
|
An Investigative Approach to Science |
|
A possible approach to teaching investigation |
|
|
Step 1 - Brainstorming/getting ideas |
Step 2 - Choosing the variables |
|
Step 3 - Asking a question |
Step 4 - Planning the experiment |
|
Step 5 - Carrying out the experiment |
Step 6 - Recording & Presenting (1) |
|
Step 7 - Recording & Presenting (2) |
Step 8 - Recording & Presenting (3) |
|
Step 9 - Interpreting & Evaluating (1) |
Step 10 - Interpreting & Evaluating (2) |
|
Step 11 - Reporting back |
|
|
Step 1 - Brainstorming or getting ideas |
||||||||||||||||
|
The poster is made available to the children. This may be put up on the wall as a poster. An A4 copy may be made available or copies given to group leaders or to all of the children. The teacher then initiates a class discussion on the investigation topic. Note - The following example refers to the unrevised 5-14 Guidelines :- |
|||||||||||||||
|
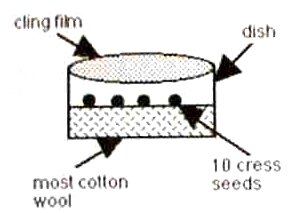
e.g. the investigation may reflect the key feature - Understanding Living Things and the Processes of Life - at the P4 to P6 stage factors which affect germination and growth (National Guidelines Pages 16-17).The teacher may begin by reminding the children about what germination means, then pose the question What affects germination? The purpose of the investigation is to discover if and how a particular factor affects germination in a particular plant, e.g. cress. |
|||||||||||||||
|
An example of an investigation from the Revised Guidelines may reflect the Attainment Outcome - Living Things and the Processes of Life - at the S1 stage (Level E) - Attainment Target - identify the raw materials, conditions and products of photosynthesis. The teacher may begin by reminding the children about what photosynthesis means, then pose the question - What affects the growth of the plant and its ability to photosynthesise? The purpose of the investigation is to discover if and how a particular factor affects growth in a particular plant, e.g. peas. |
||||||||||||||||
|
The children are asked to suggest any factor which might affect growth of the peas. As each factor is suggested it is added to the list, it may be helpful for the children to write these on Post-It pads and stick them to the poster; or they may draw a picture to illustrate these; or pictures may be supplied. |
||||||||||||||||
|
Step 2 - Choosing the variables |
|||||||||||||||||||||||||||||
|
Once again the poster is made available to the children. This may be put up on the wall as a poster. An A4 copy may be made available or copies given to group leaders or to all the children. |
||||||||||||||||||||||||||||
|
Fair Testing
Note: the words independent variable and dependent variable need NOT be taught at this stage! |
|||||||||||||||||||||||||||||
|
Step 3 - Asking a question |
|||||||||||
|
At this stage the children are being asked to select the variable which they want to investigate. They choose one of the things which they have said they could change |
||||||||||
|
Step 4 - Planning the experiment |
|||||||||||
|
The children now plan the experimental procedure. It is very important to stress that only one of the variables can be changed during the experiment. As a result the variable being measured will, presumably, change. All other variables must be kept constant, that is they do not change. This is to ensure a fair test. A fair test is one in which only the independent variable is seen to cause a change in the dependent variable. If for example two things change, say temperature and humidity, you cannot be sure which of these causes the change in the dependent variable; it may be temperature or it may be humidity or it may be a combination of both. |
||||||||||
|
Step 5 - Carrying out the experiment |
|
Before they carry out their experiment it is important that the teacher makes sure |
|
Step 6 - Recording & Presenting (1) |
|||||||||||
|
|
The children are encouraged to record the results from their investigation by producing a table of results. The table includes the independent variable (what they were changing) and the dependent variable (what they were measuring). The production of the table of results will assist the children in constructing a bar chart or graph of their results. An average may need to be taken to get more accurate results. |
||||||||||
|
Graphs and charts are powerful tools because they enable children to see the result of what they changed (the independent variable) affecting what they measured (the dependent variable). This gives a picture of the information they have collected and helps them to identify patterns and trends in the information. It also helps the children to develop understanding by relating pattern and trends to their scientific knowledge. The type of graph which is appropriate depends on the type of variable which is used for the key variables i.e. what they change (independent variable) and what they measure (dependent variable). The table below shows the type of graphs which should be drawn for different types of variables. |
|||||||||||
|
Step 7 - Recording & Presenting (2) |
||||||||||||||||||||||||||||||||||||||||||||||||||||||||||||||||||||
|
What type of graph should be used?
|
||||||||||||||||||||||||||||||||||||||||||||||||||||||||||||||||||||
|
Step 8 - Recording & Presenting (3) |
|||||||
|
Looking for a pattern in the results
|
|
Step 9 - Interpreting & Evaluating (1) |
||||||||
|
Finding a pattern in the results
|
|
Step 10 - Interpreting & Evaluating (2) |
||||||||||
|
Drawing a valid conclusion
|
||||||||||
|
Step 11 - Reporting back |
|
After the practical part of the investigation is over, a reporting back session is vital. The importance of this stage is frequently under estimated and on occasion bypassed altogether (although admittedly often because of pressure of time). The reporting back session needs careful handling if the learning outcomes are to be fully achieved. It is at this point that the concepts of evidence take on their full impact because the pupils have to use their own evidence to justify the conclusions at which they have arrived. |
© SSERC . Designed by , Network Designer, SSERC